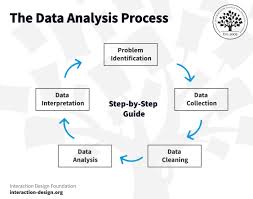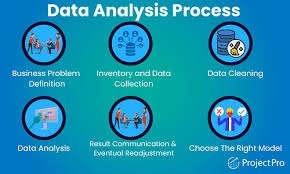
In the realm of data science, one of the most critical steps is understanding the data before making any predictions or drawing conclusions. This crucial phase, known as Exploratory Data Analysis (EDA), serves as the backbone of any data-driven project. EDA involves summarizing the main characteristics of a dataset, often using visual methods. Here’s a deep dive into what EDA is, why it’s important, and how it’s performed.
What is Exploratory Data Analysis?
Exploratory Data Analysis is an approach to analyzing datasets to summarize their main characteristics, often with visualizations. It was coined by John Tukey, a mathematician, in the 1970s. EDA focuses on identifying patterns, spotting anomalies, testing hypotheses, and checking assumptions with the help of summary statistics and graphical representations.
Why is EDA Important?
- Understanding Data Distribution: EDA helps in understanding the distribution of data points. It reveals the underlying patterns and structures that might not be apparent from raw data alone.
- Identifying Anomalies: Outliers or anomalies can significantly affect the performance of a model. EDA helps in identifying these anomalies so they can be addressed appropriately.
- Hypothesis Testing: Before building any predictive model, it’s crucial to have a hypothesis about the data. EDA aids in testing these hypotheses, ensuring that the assumptions made are valid.
- Feature Selection: EDA helps in identifying the most important features of a dataset, which can be critical in improving the performance of machine learning models.
- Data Cleaning: Data often comes with noise. EDA assists in identifying missing values, incorrect entries, and inconsistencies in the data, paving the way for clean and reliable datasets.
How is EDA Performed?

EDA can be broadly categorized into graphical and non-graphical methods, with both playing a complementary role in understanding the data.
Graphical Methods
- Histograms: These show the frequency distribution of a single variable, giving insights into its central tendency and variability.
- Box Plots: These depict the distribution of data based on a five-number summary (minimum, first quartile, median, third quartile, and maximum). They are particularly useful for detecting outliers.
- Scatter Plots: These plots show the relationship between two variables and can reveal correlations, trends, and clusters in the data.
- Line Graphs: Used for time series data, these graphs show trends over time.
- Correlation Matrices and Heatmaps: These visualize the correlation between multiple variables, helping in identifying multicollinearity.
Non-Graphical Methods
- Descriptive Statistics: Measures such as mean, median, mode, standard deviation, and variance provide a summary of the dataset’s characteristics.
- Cross-tabulation: This method is used for analyzing the relationship between two categorical variables.
Tools for EDA
Several tools and programming languages offer robust functionalities for performing EDA. Some of the most popular ones include:
- Python: With libraries like Pandas, Matplotlib, Seaborn, and Plotly, Python is a powerful tool for EDA.
- R: Known for its statistical prowess, R offers numerous packages like ggplot2, dplyr, and tidyr for effective EDA.
- Tableau: A data visualization tool that allows users to create a wide range of interactive and shareable dashboards.
Conclusion
Exploratory Data Analysis is an indispensable step in the data science process. It provides a deeper understanding of the data, helps in making informed decisions, and lays a strong foundation for building robust predictive models. By leveraging graphical and non-graphical methods, data scientists can uncover the hidden story behind the data, ensuring that subsequent analyses are accurate and meaningful.Whether you’re a seasoned data scientist or a novice, mastering EDA is crucial. It not only enhances your analytical skills but also empowers you to make data-driven decisions that can drive impactful outcomes.


